
So the leading digit graph looks pretty much the same between 10 iterations and 10,000. The double leading digit graph doesn’t. Is that a resolution issue or indicative of some deeper, underlying property?
Let’s do a million iterations, for 1,000,001 values of x.
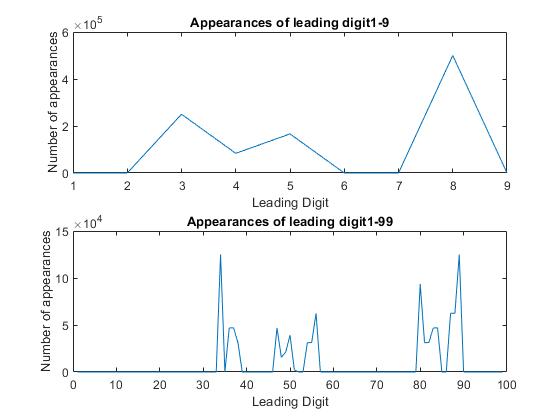
The double leading digit graph looks fairly similar to the n=10,001 graph.
But there’s a catch.
The 11423 (a) iteration yielded x = 0.5 due to truncation error.
The next time that happens is n=44063. (b)
It happens again at 79519. (c)
(c-a)/(b-a) =|= 2
Inception noises.